What is centralized data management?
Centralized data management is a process of consolidating data from multiple sources so it can be stored, organized, and managed in a single, unified system. Learn how it can benefit your business and how to get started.


Published:
September 17, 2018
Last updated:
August 27, 2025

Finding it hard to keep up with this fast-paced industry?
Subscribe to FILED Newsletter.
Your monthly round-up of the latest news and views at the intersection of data privacy, data security, and governance.
Subscribe Now
Key takeaways
- Centralized records management reduces costs by cutting duplicate storage and saving infrastructure.
- Unifying data management improves data quality and consistency across systems with a single source of truth
- Centralizing data into one pane of glass enhances security, governance, and compliance with unified policies.
- Organizations also get speedier access and retrieval, boosting productivity and operational efficiency
- Centralized data management supports better decision-making with comprehensive, real-time insights
What is centralized data management, and what are the benefits?
In 2021, a McKinsey & Company study revealed how costly data silos are for businesses; back then, it was $3.1 trillion annually on average. As data volumes increase exponentially and automated systems handle everything from customer interactions to compliance, the stakes and costs of disparate data have never been greater.
Centralized data management is the process of consolidating data from multiple sources so it can be stored, organized, and managed in a single, unified system. This approach makes it easier for users to retrieve the data they need while improving its consistency, completeness, and data accuracy.
It’s often hard to make a business case for centralized records management because the nature of the benefits can be difficult to quantify. For that reason, we need to look at its advantages from a qualitative standpoint and focus on how it streamlines operations. This guide will do just that and also offer a guide to help you get started with your own data centralization strategy.
First, though, let’s make the case for records management.
Why records management matters
Put simply, managing records is a necessity because data and content are strategic assets that make a direct contribution to organizational objectives, efficiency, and effectiveness.
Since data collection is critical for businesses, it makes sense that managing that data would be equally important. In most cases, laws and regulatory requirements specify that certain records should be created and kept for specific periods of time. In fact, records are critical to helping organizations:
- Undertake and continue their business functions
- Maintain data quality, data integrity, data consistency, and data security
- Make good business decisions
- Serve their customers and clients
- Significantly enhance customer experiences
- Empower data analysts to create actionable insights
- Improve their reputation
- Respond to legal issues, investigations, inquiries, and audits
When these records are divided among customer-facing systems, spreadsheets, and analytics platforms, it can become increasingly difficult to maintain an accurate picture of business operations. To elaborate, let’s take a closer look at centralized data management and compare it to the alternative.
Centralized vs decentralized data management
A centralized data management system consolidates data from across multiple sources into a single database. If you’ve worked with enterprise data or a data lake, you’re likely familiar with centralized repositories. Everything is stored in one place, and the data is consistent, accessible, and secure.

In contrast, decentralized data management is scattered across multiple systems or nodes. There isn’t a single, unified architecture here. Instead, data resides at different points in a network or infrastructure.
There are pros and cons to both approaches. However, a centralized data model is typically more efficient, consistent, and secure, as it provides a ‘single source of truth’, and no competing and isolated systems are in play.
7 benefits of centralized data management
Now, let’s examine the benefits of centralized data management to help you decide whether it’s the right approach for you.
1. Reduced cost
For many organizations, cost reduction is the primary reason for data management. Effective data management helps businesses eliminate data duplicates and control the data lifecycle, which can translate into savings by reducing the amount of data and the costs associated with storing it.
For example, if an organization stores 400 TB of electronic information and can eliminate 30% of this volume by managing the content lifecycle more effectively, it saves 120 TB of storage.
This saves $198,120.00 based on infrastructure costs alone, even before the benefits of reallocating an IT FTE’s time that would otherwise be spent managing this additional data.
A systematic and automated records management process can reduce the cost of these obsolete records and, at the same time, reduce the inherent risk present in keeping information for longer than required.
RecordPoint’s Connector Framework can simplify data integration and management by giving you the ability to connect cloud-based and on-premise content sources in a matter of minutes.
2. Reduced risk
The recent introduction of broad-based compliance and information privacy laws, such as the Australian Privacy Act 1988, the GDPR, and the CCPA, means records management will play an increasingly important part in any organizational risk strategy.
But data isn’t the only information that requires careful management. For instance, consider the vital records, such as lease agreements, signed contracts, articles of incorporation, patents, and intellectual property, that organizations keep. These one-of-a-kind records are just as important in ensuring continuity in the event of a disaster, and they need to be secure and available at all times.
An effective corporate risk management strategy includes a systematic retention program to minimize risk related to legal matters and regulatory compliance. These risks include:
- Security risks, such as unauthorized disclosure, modification, or destruction, from either staff members or external threats.
- Availability risks, such as malicious or environmental damage, theft, improper storage, or a lack of backups, hinder a record’s availability, readability, or usability.
A well-designed records management system addresses both types of risks across both electronic and physical content to ensure records remain secure and usable for the entire retention period.
This reduces exposure during civil litigation or investigation, while also ensuring records maintain their critical role as evidence in public liability, personal injury, breach of contract, and wrongful dismissal suits.
3. Improved data quality and consistency
Business data scattered across systems makes inconsistencies inevitable. As an example, departments that operate in a vacuum often unintentionally have duplicate versions of sensitive customer records or store insights that conflict with those of another team.
Inconsistency is a major concern. Without a systematic approach to records management, there are no shared standards that govern how information should be stored and maintained, making it harder to trust insights and act on them with confidence.
Centralized data management enforces consistent standards for all information across an organization. This creates a single source of truth, which has a direct impact on everything from broad operational decisions to day-to-day customer communications, as it ensures leaders and teams always have the most complete, up-to-date version of data.
4. Enhanced security and governance
Decentralized data can make it challenging to control who has access to what. For instance, different teams might use separate systems with varying degrees of security, or access controls might be applied inconsistently based on internal playbooks. All of this increases the risk of breaches and leaks.
Centralized data management gives businesses the ability to create blanket security policies, such as encryption and access controls. Managing trusted data from a single system also helps organizations enforce consistent governance rules and track interactions with sensitive content more cleanly.
Aside from helping with your security posture, this is also a massive boon for compliance and audit preparation.
5. Simpler access and retrieval
Productivity and operational efficiency take a hit when team members need to dig manually through outdated records or check with other departments to find the right file for their needs.
One of the biggest benefits of centralized data management is that it brings everything together in one place. This means that, when a team member wants to find information, they can simply search for the standardized file in the centralized database and access the information. There’s no need to figure out where the data came from to find it.
Aside from enabling faster retrieval, this also frees up time that your teams can spend on more valuable tasks and projects, boosting day-to-day productivity.
6. Better decision-making
Centralized data also helps with high-level decision-making because you’re no longer piecing together disparate insights from dozens of spreadsheets or waiting for each team to provide the right report. This yields two major benefits:
- You can make decisions faster, giving you more agility in response to customer trends.
- You can be sure your decisions are based on the complete picture.
In essence, ensuring you have a single source of truth gives leadership the confidence to make decisive calls quickly because they’re backed by real-time data.
7. Increased revenue
When managed effectively, recorded information has a quantifiable value that is marketable and sellable. Customer profiles and mailing lists are obvious examples, but this benefit also applies to broader business intelligence information, such as intellectual property or data about customer or client purchasing habits, preferences, and behaviors.
Consider the organizational value of intellectual property, such as proprietary technologies or processes, trade secrets, patents, trademarks, and copyrights. When correctly managed, these data repositories can create new business opportunities. One example is extracting intellectual property to market a new product, production method, or service.
Efficient management of these types of information also enables easy discoverability and retrieval, giving your organization a distinct competitive advantage.
How does centralized data management work?
Centralized data management is all about creating a single source of truth. Data is consolidated into one system for storage, processing, and governance. But how exactly does it work?
1. Data integration
Data from multiple sources needs to be combined and stored in a centralized database. This process is known as master data management (MDM). MDM tools are used to automate data cleansing and integration for use by each department.
2. Centralized repository
Both structured and unstructured data are then stored in a data warehouse or data lake. Organized data is easier to manage and retrieve.
3. Centralized control
These centralized data systems are overseen by centralized data teams, who are responsible for ensuring the integrity, security, and accessibility of data. The central oversight makes it easier to implement data governance frameworks and meet compliance.
4. Data accessibility
Centralizing data creates a single point of access and eliminates blind spots and data silos. Employees access data catalogs, dashboards, and APIs to get the data they need to do their jobs. This eliminates the frustration of retrieving data from multiple data sources.
5. Data processing
Centralized platforms continue to ingest raw data and prepare it for employees, data teams, and data engineers to use for advanced analytics using analytics tools.
6. Health checks and optimization
Automation tools and monitoring systems detect anomalies and streamline repetitive tasks to improve data efficiency.
7. The ability to scale and grow
Cloud-based solutions then dynamically scale according to demand and deploy compression techniques and tiered storage to maximize value and reduce waste.
How to get started with centralized data management
Don’t be daunted by the task of consolidating data. By taking the time to understand your data environment and the costs involved, you can start planning your centralized data strategy.
Step 1: Understand your costs (and savings)
Knowing your cost base and the potential savings from investing in a records management solution is key to getting started. This requires a thorough analysis of IT infrastructure and data storage costs, as well as related costs such as IT personnel and soft costs. Also, be sure to add the impact on productivity brought by managing high volumes of obsolete records.
Step 2: Prepare for implementation
Before getting started, assess your records management readiness:
- Have you designated a formal records management role in your organization?
- Do you have a network of designated liaisons for records management in each organizational unit?
- Have you established a formal records management data program within the organization?
- Have you instituted policies and procedures for records management and implemented an automated records management system?
- Have you identified and mapped the applicable laws and regulations that apply to your organization and industry sector (such as FINRA, HIPAA, SOX, GLBA, US 36 CFR, GDPR, DoD, etc.)?
To ensure the successful implementation of a solution, you have to be able to answer yes to each of those questions.
Step 3: Identify high-risk records
Next, identify the high-value records within the organization that are at high risk. Value can normally be determined by two main factors:
- Permanent value: These are generally one-of-a-kind records, such as articles of incorporation, trademarks, and intellectual property.
- Business value: These are records that enable organizations to make data-driven decisions, undertake and continue their business functions, serve their customers and clients, and keep their legal and regulatory obligations.
Once you’ve made these assessments, you’re ready to implement a records management solution.
What are some examples of effective centralized data management?
Three-quarters of organizations have already deployed a centralized data management strategy. Let’s look at the approach in action with two real-world examples.
Compliance made easy
A large municipal organization that oversees an area on the West Coast of the United States, with a complex organization and tens of thousands of employees, needs to comply with state and federal regulations.
A 2018 electronic records management assessment found that records and information management were occupying significant staff time, resources, and effort due to a lack of technical infrastructure. These issues made compliance with retention laws more difficult and were exacerbated due to the move to Microsoft 365 and the beginning of the COVID-19 pandemic in 2020.
The RecordPoint platform’s federated data management helped centralize governance, with in-place management also reducing overhead. By embracing RecordPoint, the organization made a rapid transition to digital tools, providing the confidence that all information is managed.
AIATSIS transforms its information governance strategy to lower risk
The Australian Institute of Aboriginal and Torres Strait Islander Studies (AIATSIS) is an Indigenous-led, national institute that celebrates, educates, and inspires people from all walks of life to connect with the knowledge, heritage, and cultures of Australia’s First Peoples. The organization cares for a collection of Aboriginal and Torres Strait Islander records that encompasses more than one million films, photographs, audio recordings, art, objects, and other resource materials.
With a small team and limited records experience, the Australian Institute of Aboriginal and Torres Strait Islander Studies was facing challenges in ensuring compliance across the organization. They needed a data inventory to centralize governance across their data corpus, with minimal disruption to user workflows.
By adopting RecordPoint, AIATSIS gained federated data management to centralize governance across business systems, including SharePoint Online and Microsoft Teams, as well as in-place management to reduce overhead.
RecordPoint’s automated classification allowed them to rapidly catalog and classify their data corpus at a high degree of accuracy.
The result was a lower compliance risk and increased confidence that everything was captured, all with less effort for the records team.
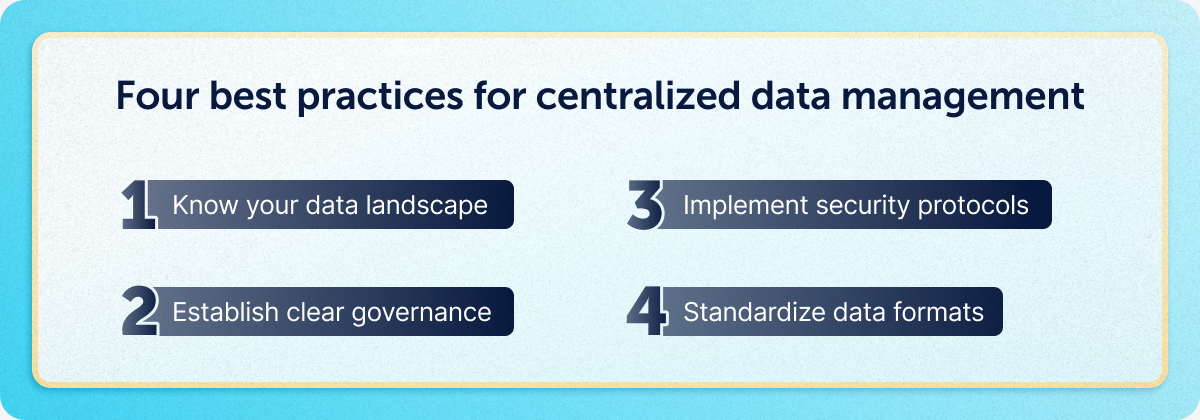
4 best practices for centralized data management
Here are four best practices to improve your data:
1. Know your data landscape
Don’t run before you can walk. Take the time to understand the true scale of your data assets. Start by identifying your structured and unstructured data sources so you know what and how you need to bring everything together. Don’t forget about legacy systems, and older spreadsheets and CRMs.
2. Establish clear governance policies
Centralized data management works best when you have clear governance frameworks in place. Make sure to create policies that outline who can access, modify, and manage your data.
3. Implement security protocols
You must also set up role-based data access controls and encryption to meet any relevant regulations and ensure compliance standards. Your centralized system must comply with GLBA, GDPR, and APA (depending on where your business is located).
4. Standardize data formats
When data comes from various sources, it often comes in different formats, which makes it harder to manage. By creating standard data formats and protocols and converting your data to meet these standards, you’ll be able to access the most accurate, up-to-date information, and your systems will be able to communicate seamlessly.
Master data management: A key component
Master data management (MDM) is the principle of creating and maintaining a reliable, single version of your organization’s most critical data, like your customer, employee, and product information, across every department and system.
The main benefit of master data management is that it lays the foundation for everything else within your business. It ensures every system in your tech stack speaks the same language and gives your team the confidence to make data-driven decisions.
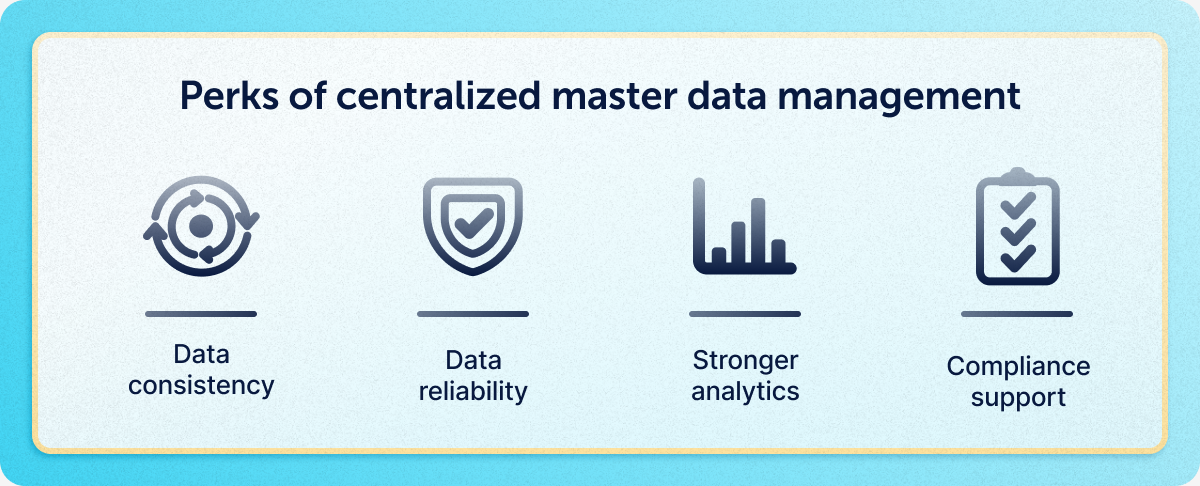
Specific benefits of centralized master data management
Here are some of the ways centralized MDM can benefit your organization:
- It provides a consistent, accurate view of all core business data on every system, reducing conflicts between departments using different platforms.
- It improves the quality and reliability of data for critical entities, which leads to more efficient service delivery and fewer manual errors.
- It facilitates more accurate analytics and reporting related to core business operations, fuelling smarter decision-making.
- It supports compliance and reduces the risks associated with inconsistent or duplicate master data.
In short, the goal here is to create a “golden record” that holds all of the most up-to-date information in an organization’s data ecosystem.
Data management standards
Strong data management standards essentially act as a “common language” for handling data securely. They lay out guidelines that every team and individual can learn and stick to, making them essential for consistency and trust across an entire organization.
The exact standard you use as your benchmark will vary depending on your industry and the location of your business. Here are some robust global frameworks, along with some U.S. and Australia-specific models:
International standards
Global standards determine how data is stored and governed across borders and industries.
- FAIR Principles: These principles originate in the Netherlands but provide a global framework for making data findable, accessible, interoperable, and reusable (FAIR), with the goal of enhancing research and innovation through consistency.
- ISO 27001: This is considered the gold standard for information security management systems (ISMS). It offers a framework to help businesses implement and maintain their ISMS to protect sensitive data from threats.
- DDI (Data Documentation Initiative): DDI provides a technical framework for describing research data, particularly in the context of academic, research, and government sectors. It is a free and open international initiative.
US-centric standards
These standards are tailored to businesses that operate in the U.S.
- NIEM (National Information Exchange Model): NIEM gives businesses a framework for sharing information between organizations. While particularly focused on the government sector, it’s still a valuable resource for any business engaging in collaborative projects.
- CMMI for Data Management: This process improvement model provides a framework to help U.S. organizations build, improve, and manage their enterprise data management.
AU-centric standards
Finally, let’s touch on some of the standards that focus on the Australian market.
- Australian Government Data Sharing Principles (DSPs): These principles give a clear and practical framework to help public sector agencies share data safely. They strongly focus on privacy protections and transparency.
- AS ISO/IEC 38500: This Australia-specific adaptation of the global ISO/IEC 38500 standard homes in on effective and efficient IT within Australian organizations, with the goal of ensuring robust data governance and accountability.
In addition, while not a specific standard, the OAIC also offers a wealth of privacy-focused guidelines that align with the Australian Privacy Principles (APPs) found in the Australian Privacy Act 1988.
Common tools for centralized data management
So, what tools can you use to achieve data centralization? Here are a few to consider:
- Database management systems (DBMS): Software like this allows you to create and manage structured data within databases, helping you enhance security and maintain data integrity and accessibility. Examples include platforms like Oracle Database.
- Data warehouses/data lakes: These are essentially large, centralized repositories of data that store large volumes of structured data (data warehouses) or structured and unstructured data (data lakes) from multiple sources.
- Master data management (MDM) Tools: MDM solutions are there to help you create a single, unified source of truth for all of your critical business data, such as customer and employee records.
- Data integration tools (ETL/ELT): Extract, transform, and load (ETL) and extract, load, and transform (ELT) tools help you convert data into a standardized format and transfer it to a centralized system. Talend is a well-known example of this kind of tool.
- Centralized document management system (DMS): This software helps you create, store, and manage electronic documents alongside images of paper-based documents in a centralized document repository. Think of it as a scalable digital filing cabinet.
- Data governance tools: Platforms like RecordPoint will help you unify data, classify it consistently, and then track it throughout its lifecycle to ensure it’s compliant with regulations.
Once you have all of your data in data management systems, business intelligence (BI) and analytics tools can help you visualize and analyze your information for smarter decision-making. Think of this as the final piece of the puzzle that transforms your unified data into real-world insights.
Future trends in centralized data management
Centralized information management may seem like a fairly static concept, but this couldn’t be further from the truth. Emerging trends are rapidly reshaping how organizations store and govern their data, driven both by automation and evolving compliance.
Here are some trends to watch over the coming years:
- AI-driven governance: AI for data governance isn’t a new concept, but going forward, we’ll see new developments in the way centralized data platforms use AI to automate data classification and flag risks in real time; think proactivity over reactivity.
- ‘Smart lakes’: Future data lakes will be fully aware of regulatory policies and guidelines at the platform level. This will let systems enforce rules as soon as data is ingested, rather than ad hoc after the fact.
- Zero-copy integration and data mesh convergence: Centralized governance may combine with decentralized access in the future. This effectively means data will be managed centrally, but it will reside closer to the domain in which it’s created, providing teams with faster access to the information most relevant to them.
- Digital sovereignty and geo-fencing by design: As data residency and sovereignty concerns grow, we’ll likely see centralized platforms expand to support geofencing, which will allow organizations to control how their data is stored, processed, and accessed based on national or regional requirements.
The key to getting ahead in the future is laying the groundwork now. Put a strategy in place that unifies and governs your data, and build an MDM that can scale with your growth and with the new opportunities on the horizon.
Final thoughts
Centralized data management combines data from various sources, bringing order to a chaotic data environment. By consolidating data from multiple sources and creating a unified architecture, organizations can make data more secure, consistent, and accessible. Users will know exactly where data resides when they need it the most.
Are you ready to act? RecordPoint can centralize your data and deliver the personalized experiences customers demand. Schedule a demo today.
FAQs
What does centralized data management mean?
Centralized data management is about consolidating data from multiple sources into one single location. The aim is to take back control of data so it can be easily accessed and managed to drive productivity gains.
What is the difference between centralized and decentralized data management?
Centralized data management focuses on a single source of truth with uniformity and integration at its core. This contrasts with decentralized data management, which involves multiple systems and can lead to inconsistencies and inefficiencies.
What are the challenges of decentralized data management?
Integrating multiple data sources can be complex and might be met with resistance from users who are accustomed to legacy systems. To address these challenges, make sure to create strategic plans for your migration and communicate clearly with stakeholders about the changes and benefits.
What is an example of centralized data?
Examples of centralized data include data warehouses, data lakes, and online database software. Centralized data is always stored in one location and is typically managed by a central authority or server.
Discover Connectors
View our expanded range of available Connectors, including popular SaaS platforms, such as Salesforce, Workday, Zendesk, SAP, and many more.
Explore the platform
Find and classify all your data
Discover your data risk, and put a stop to it with RecordPoint Data Inventory.
Learn More
Related Posts
See All